

Splunk is one of the most popular options to externalize the logs of our Mule applications. In this post, we will see how to get your Splunk instance ready to receive these logs.
Prerequisites
To follow this post, we need to have a Splunk instance up & running. If you don’t have one, there’s a quick way to spin up an Enterprise trial for testing installing Splunk on a docker container. Follow the steps on the post How to...Remember to run the container with at least two ports available:
- Port 8000 - For the Web Management Console
- Port 8088 (or another one of your choice) - For the HTTP Event Collector. This is the port we’ll use to receive the logs from Mule
Create a new index
A Splunk index is a data repository where Splunk stores incoming data for search and analysis. When data is ingested into Splunk (via logs, metrics, or other sources), it is indexed to make it searchable. Each index is essentially a collection of data that is organized and optimized for quick retrieval and analysis. Think of Splunk as a big database where each index is a table.Although we could skip this step and use an existing index, it’s a best practice to create a dedicated index for the mule logs. When ingesting data from different sources (e.g., web server logs, application logs, database logs, mule logs), creating separate indexes for each type of data allows for better organization and more efficient searches.
To create a dedicated index for the Mule logs we will do the following:


HEC allows us to send events (logs, metrics, JSON objects, etc.) to Splunk using HTTP POST requests. This makes it highly flexible for collecting data from cloud services, custom applications, mobile devices or our mule apps
Each HEC endpoint is associated with a token. To send data, the client (in our case our mule app) includes this token in the request headers for authentication. This ensures security and allows Splunk to identify the data source.. For our mule apps, the token associated with the HEC will be added to the configuration of the log4j.
This is how we can create an HEC for our mule logs:


If we get a successful response that means our HEC is working. If that does not work, make sure the HEC endpoint is accessible and that there’s no firewall or security policy blocking the incoming traffic on that port.
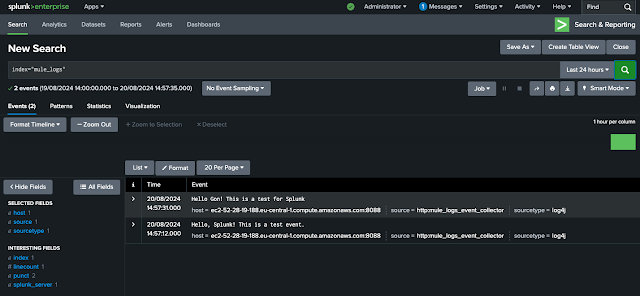
Lastly, double check you can see the test event in the Splunk reporting app. Open the Search & Reporting App in the Splunk web console and search for index="mule_logs". That should give us all the entries in our custom index.
With that, our Splunk instance is ready to receive the logs from our Mule apps. For that, one of the most common options is to set up an Appender in the log4 configuration of our app. Check out these post to learn how to configure your mule app to send logs to your newly created HEC in Splunk:
To create a dedicated index for the Mule logs we will do the following:
- Go to Settings > Data > Indexes
- Click on New Index on the top right corner
- Give it a name and leave the rest of the options as default. In this example our index is called mule_logs
Create an HTTP Event Collector
The HTTP Event Collector (HEC) in Splunk is a mechanism that allows us to send data directly to our Splunk instance via HTTP or HTTPS. It provides an API-based way to collect data from applications, services, and devices that support HTTP requests, enabling real-time data ingestion into Splunk without the need for forwarders or agents.HEC allows us to send events (logs, metrics, JSON objects, etc.) to Splunk using HTTP POST requests. This makes it highly flexible for collecting data from cloud services, custom applications, mobile devices or our mule apps
Each HEC endpoint is associated with a token. To send data, the client (in our case our mule app) includes this token in the request headers for authentication. This ensures security and allows Splunk to identify the data source.. For our mule apps, the token associated with the HEC will be added to the configuration of the log4j.
This is how we can create an HEC for our mule logs:
- Go to Settings > Data > Data Inputs
- In the HTTP Event Collector, select Add new
- Give it a name and click Next
- in the Input settings:
- Select log4j for Source Type
- Add the index we've created in the previous step to Allowed Indexes
- Make that index the Default Index
- Click on Review and Submit
- Once it's done you'll see that a token has been created for the event collector. Copy the Token value, we'll use it later in our mule app
- Get back to Settings > Data > Data Inputs. You should see that now theres one HTTP Event Collector. Click on HTTP Event Collector
- Go to Global Settings and enter the following values
- All Tokens → Enabled
- Default Source Type → Application > log4j
- Default Index → Your index
- Disable SSL
- HTTP Port Number → this is the port we open in our Docker container so that it the event collector can get receive traffic.
Test the HTTP Event Collector
Here’s an example of how to send an event using acurl command to test our HEC:curl -k https://<splunk_server>:8088/services/collector/event \
-H "Authorization: Splunk <your_HEC_token>" \
-d '{"event": "Hello, Splunk! This is a test event."}'Open the Search & Reporting App in the Splunk web console and search for index="mule_logs". That should give us all the entries in our custom index.
Lastly, double check you can see the test event in the Splunk reporting app. Open the Search & Reporting App in the Splunk web console and search for index="mule_logs". That should give us all the entries in our custom index.
With that, our Splunk instance is ready to receive the logs from our Mule apps. For that, one of the most common options is to set up an Appender in the log4 configuration of our app. Check out these post to learn how to configure your mule app to send logs to your newly created HEC in Splunk: